What is the purpose of the oga.jod.li niche mechanism?
The purpose of the https://en.oga.jod.li niche mechanism is to avoid a concentration of the chromosome in a narrow space and spread the search for fitter chromosomes avoiding local optima. The mechanism can be thought of as a penalty for consanguinity. This can avoid evaluating chromosomes that resemble too much existing ones.
How is this implemented?
If the niche mechanism is activated (ndr>0), the parent chromosomes selection is not based on the raw fitness of the chromosomes but rather on the shared fitness calculated based on the concentration of the chromosomes. The sigma is the distance within which we consider 2 chromosomes to be close enough to share their fitness. The sigma is calculated from the ndr parameter and the maximum distance between any evaluated chromosome within the population. Then, the power sigma is applied to lower the influence of the distance on the concentration calculation.
This implementation is inspired by the Goldberg and Richardson (1987) fitness sharing algorithm described page 20 of “A Species-Conserving Genetic Algorithm for Multimodal Optimization” by Michael Scott Brown (2010).
As the population is limited to a 100 evaluated chromosomes, a deletion takes place once this number is reached. The chromosomes deleted are those with the lowest shared fitness (while the non-niche behaviour deletes the lowest raw fitness) with the exception of the latest chromosome with the highest fitness which will never be deleted by the population limits.
Which are the parameters?
There are two parameters on https://en.oga.jod.li for the niche mechanism which can both be optimised through the auto optimisation:
- The niche distance ratio (ndr) (0-100). Disable niche with 0. Otherwise, higher value means lower penalty on the fitness (shared fitness) for chromosomes being close to each other. The ndr divides the longest distance between two evaluated chromosomes within the population to define the niche size (sigma). The chromosomes within a niche get penalised for being too close to each other. Note that a ndr=0 being closer to the ndr=100 functionally compared to a ndr=1, for the auto evolution of the genetic algorithm parameters, the ndr=1 becomes a 0 and the ndr=0 becomes a 100. A reasonable ndr value is 10.
- The niche power sigma (psi) (1.00-10.00). Only makes sense if ndr != 0. Higher value means higher penalty on the fitness (shared fitness) for chromosomes being close to each other. The psi here is equivalent to the alpha used by Michael Scott Brown (2010) to explain the Goldberg and Richardson (1987) fitness sharing algorithm. A reasonable psi value is 1.
How does this impact the genetic algorithm?
To show the impact of the niche mechanism on the genetic algorithm, two evolutions have been run with the same parameters except for the population name and niche ones. Here are the other parameters:
- The auto optimisation: false (we don’t want the auto optimisation to change the niche parameters)
- The mutation rate: 0.3
- The crossover rate: 0.2
- The elitism rate: 0.5
- The minimum length: 2
- The maximum length: 3000
- The encoding: xdigit (hexadecimal)
- The envelope: CSV
- The number of chromosomes per batch: 40
The parameters which were different are the following ones.
First evolution without niche:
- The population name: noniche52
- The niche distance ratio (ndr): 0 (niche disabled)
- The niche power sigma (psi): not relevant
Second evolution with niche:
- The population name: noniche52
- The niche distance ratio (ndr): 10
- The niche power sigma (psi): 1
The objective of the evolution consisted in finding the shape and pixels of a PNG image that would have a smaller size interlaced than non interlaced (while usually, interlaced PNG images have a larger size than the equivalent non-interlaced). The fitness equals the size difference between the same image interlaced and non-interlaced offset by 200 to avoid being lower than 0. More explanation on the PNG interlaced size optimisation experiment can be found here.
Results of the first evolution without niche:
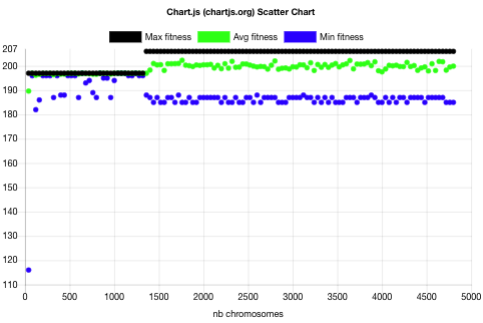
The above plot shows that the evolution without niche contained 3 main phases:
- One spread batch (40 chromosomes) with batch fitness min=116, avg=190, max=197.
- 32 narrow batches (1280 chromosomes) with batch fitness max=197 and min above 181. This 197 plateau usually corresponds to PNG images with a height of 1 pixel.
- 86 narrow batches (3440 chromosomes) with batch fitness max=206 and min above 184.
It took 1320 chromosome evaluations to find the highest fitness and it didn’t improve for the next 3440 chromosomes.
The resulting best raw fitness PNG image has a width of 3 and a height of 42. The interlaced size is 802 bytes. The non-interlaced size is 808 bytes. There it is:
![]()
Results for the second evolution with niche:
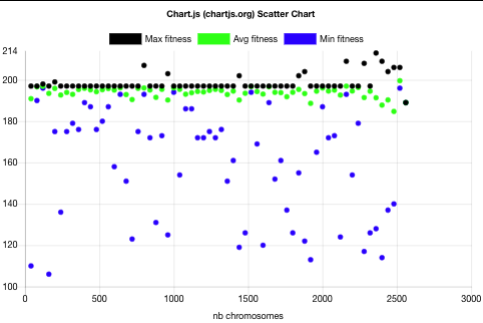
The above plot shows that the evolution with niche can be described as follows:
- The batch raw fitnesses are more spread in the niche case than in the non-niche case. Having minimal fitnesses in the niche case shows that the niche mechanism allows chromosomes with lower fitness to be taken as parents for the sake of diversity thus helping in avoiding the local optima.
- The first batch has the same characteristics as the evolution without niche: one spread batch (40 chromosomes) with batch fitness min=116, avg=190, max=197.
- Already after 3 batches (120 chromosomes), the 197 fitness plateau is overcome with a batch fitness max=198. This is 30 batches (1200 chromosomes) earlier than without niche.
- The best non-niche fitness (206) is overcome with a batch fitness max=207 after 20 batches (800 chromosomes). This is 13 batches (520 chromosomes) before the best fitness was reached for the non-niche evolution. For that measure, the niche evolution was 39% faster than the non-niche one.
- The best niche-evolution fitness 213 is reached after 59 batches (2360 chromosomes) while the best fitness reached by the non-niche evolution after the same number of batches is 206.
The resulting best raw fitness PNG image has a width of 1 and a height of 665. The interlaced size is 2597 bytes. The non-interlaced size is 2610 bytes. There it is:
![]()
Conclusion
For the considered problem (finding the shape and pixels of a PNG image resulting in a smaller size interlaced than non-interlaced), with an offset of 200, the niche enabled genetic algorithm evolution clearly outperforms the evolution without niche. It has been shown indeed that the niche evolution can be 39% faster than the non-niche evolution.
The auto optimisation page shows the results of experiments demonstrating a much better performance with niche than without for the PNG interlace file size question.
Future work
Though the conclusion has been noticed repeatedly with the interlaced PNG case, it would be preferable to provide more evidence with more experiments that the niche can be useful when evolving populations with genetic algorithms. Feel free to send your findings.
As explained in “When Sharing Fails” by Rasmus Ursem (2001), there are alternatives to sharing. Those would be interesting to implement for comparison.