Purpose
The purpose of those experiments was to determine whether an interlaced PNG image could be smaller in size than the equivalent non-interlaced PNG image.
It was already explained here why interlaced PNG tend to be larger in size than the non-interlaced PNG equivalent image. Here was the conclusion:
“The conclusion is that the uncompressed data length of identical PNG images (with pixel size >= 8) will almost always be greater in the interlaced case because more filter types must be described in the file. Though, the compression (deflate) applied to the PNG data can lead to some particular cases if we compare the resulting PNG file sizes.”
So, the purpose here is to find those particular cases.
For the experiments to be valid, here is what must be identical between the interlaced and the non-interlaced images (based on this StackOverflow response which is based on the PNG RFC2083):
- Non-pixel encoding related content embedded in the file such as palette (in the case of color type =! 3) and non-critical chunks such as chromaticities, gamma, number of significant bits, default background color, histogram, transparency, physical pixel dimensions, time, text, compressed text.
- Different pixel encoding related content such as bit depth, color type (and thus the use of palette or not with color type = 3), image size,… .
- Pixels, compression level.
Method used
The method used consisted in evolving through the auto optimised distributed https://oga.jod.li genetic algorithm with niche mechanism with the chromosome defining the shape and pixels of an image. Creating the interlaced PNG and the non-interlaced versions with ImageMagick. Comparing the file sizes in bytes. The image depth chosen is 8. The chromosome fitness is defined by the non-interlaced file size minus the interlaced file size offset by 200 to avoid reaching 0.
The following oga.jod.li parameters were constants for all the experiments (see this page for an explanation on those parameters):
- The auto optimisation: true (more details on this here)
- The mutation rate: 0.3 (initial value only as it is auto evolved)
- The crossover rate: 0.2 (initial value only as it is auto evolved)
- The elitism rate: 0.5 (initial value only as it is auto evolved)
- The niche distance ratio (ndr): 10 (initial value only as it is auto evolved) (more details on niche mechanism here)
- The niche power sigma (psi): 1 (initial value only as it is auto evolved) (more details on niche mechanism here)
- The minimum length: 2
- The maximum length: 3000
- The encoding: xdigit (hexadecimal)
- The envelope: CSV
- The number of chromosomes per batch: 40
Experiments
General shape
General shape search with no constraint except the maximum size due to the maximum length of the chromosome (3000). This is the same experiment as the one mentioned in the oga.jod.li auto optimisation parameter page.
Here are the results:
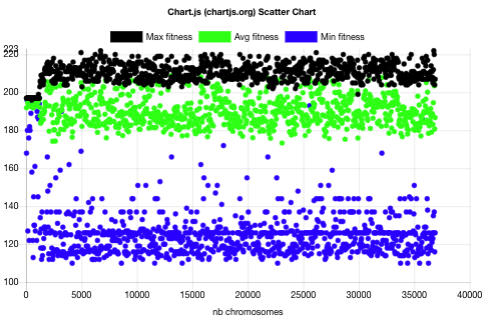
The above batch fitness plot shows that:
- The 1 pixel height plateau with a maximum fitness of 197 lasts 27 batches (1080 chromosomes). Indeed, it has been noticed, during those experiments that the evolution starts with a local optima for the PNG images with a height of 1 that leads to a maximum fitness of 197 (meaning that the non-interlaced PNG file is larger than the interlace PNG file as the fitness is offset by 200).
- The maximum fitness is 222 after 168 batches (6720 chromosomes).
- The maximum fitness did not improve for the next 754 batches (30160 chromosomes). Though, under the right circumstances, it is possible to reach a fitness of 230 as shown below.
As expected and shown below, the genetic algorithm parameters evolved over time due to the auto parameter being enabled:
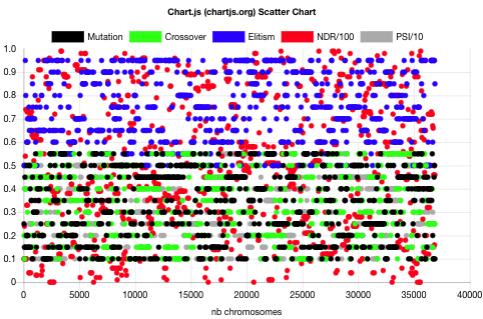
Not pattern or trend seems to be readable from the above plot. To the human eye, the parameter choices seem random.
The PNG image corresponding to the best chromosome is the following one (width 1 x height 505, 2036 bytes interlaced, 2058 bytes non-interlaced):

The shape of the image seems to be important for the fitness as the best chromosome converts to a tall image. Thus, the next experiment will constraint the image shape to a one pixel width.
One pixel width
As the best shape for a smaller interlaced PNG image file size compared to the same image non-interlaced is a tall image from previous experiment, this experiment constraints the shape to a one pixel width image.
The files for this experiment can be found here: 1px .
The outcome of the experiment are the following ones:
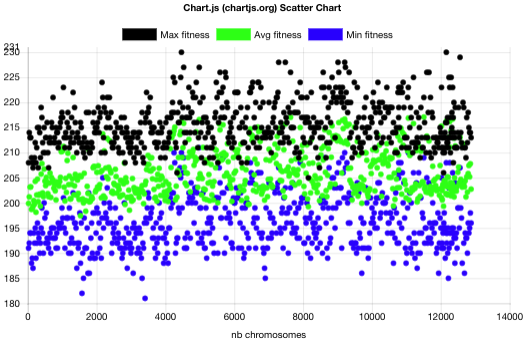
The above plot shows that:
- No one pixel width case had a fitness lower than 180.
- Maximum fitness is 230 reached after batch 105 (4200 chromosomes). This means that for the best chromosome, the interlace PNG file size is 30 bytes larger than the same image non-interlaced with the constraint on the maximum chromosome length (3000).
- The beginning of the evolution shows a fitness around 200. Which means that the 1 pixel width images interlace PNG files tend to have the same size as their interlaced version.
As expected and shown below, the genetic algorithm parameters evolved over time due to the auto parameter being enabled:
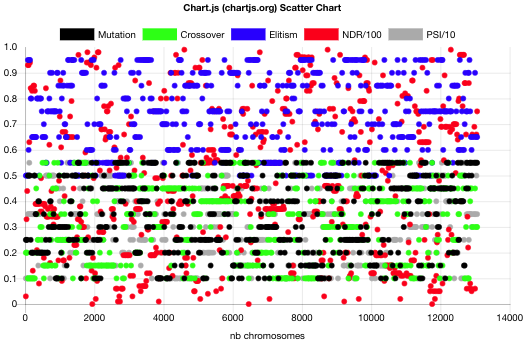
Not pattern or trend seems to be readable from the above plot. To the human eye, the parameter choices seem random.
The PNG image corresponding to the best chromosome is the following one (width 1 x height 996, 3757 bytes interlaced, 3787 bytes non-interlaced):
For the sake of observation, the above image has been split in chunks of 8 pixels high (size of the PNG Adam7 interlace pattern) put side by side and scaled up below:
No particular pattern is visible on the above image. The pixels chosen by the evolution seem to be random to the human eye.
Random one pixel width 996 pixels height
In order to know whether the fitness is due only to the shape or whether the pixels content matter, several PNG images have been generated using random pixels and the interlaced PNG size has been compared to the non-interlaced PNG size. The script is available here: random_1px_band_png.sh .
Here are the results:
One can see from the above screenshot the following corresponding fitnesses (offset 200):
- 199
- 208
- 208
- 200
- 197
- 199
- 189
- 209
- 189
- 191
- 197
This shows a good repartition around 200 but always below 230, which means that the fitness is not just a matter of image shape but also a matter of pixels content.
Why is the fitness higher for tall images?
As explained here, the main reason why the interlaced images are usually larger than the non-interlaced ones is because of the number of filters that need to be encoded. The number of filters for the non-interlaced case is the number of lines while for the interlaced case it can be calculated as follows:
nb_pass1_lines = CEIL(height/8)
nb_pass2_lines = (width>4?CEIL(height/8):0)
nb_pass3_lines = CEIL((height-4)/8)
nb_pass4_lines = (width>2?CEIL(height/4):0)
nb_pass5_lines = CEIL((height-2)/4)
nb_pass6_lines = (width>1?CEIL(height/2):0)
nb_pass7_lines = FLOOR(height/2)
So, in the case of a 1×996 image, we end up with the following number of filter encodings:
nb_pass1_lines = 125
nb_pass2_lines = 0
nb_pass3_lines = 124
nb_pass4_lines = 0
nb_pass5_lines = 249
nb_pass6_lines = 0
nb_pass7_lines = 498
This leads to a total number of filters encoding in the interlaced case of: 996
This is the same number for the non-interlaced case.
Therefore, the cost for filters encoding can be the same for 1 pixel width images and the pixel content can be rearranged by the interlacing passes so that the filtering and compression lead to a smaller size interlaced than non-interlaced.
Conclusion
To minimise the interlaced PNG image size compared to the non-interlaced PNG image size, the oga.jod.li genetic algorithm used a 1 pixel width tall image. One pixel width tall image is a reasonable way to maximise the size difference between non-interlaced and interlaced as the number of filter encoding can be the same while the number of pixels can be significant enough to lead to a rearrangement by interlacing passes so that the filtering and compression lead to a smaller size interlaced than non-interlaced. Once constrained to this shape, the evolution tends to choose the longest images. If chosen randomly, the pixels content of such image lead to a lower fitness than the best chromosome found through evolution. This means that both, the shape and the pixels content are important to have an interlaced PNG image file size smaller than the non-interlaced equivalent image.
Future work
Confirm those findings with another tool than ImageMagick as the filtering and compression choices depend on the PNG image generator.
Leave a Reply