What is the purpose of the oga.jod.li genetic algorithm auto optimisation?
Genetic algorithms have parameters which can be optimised. At some point of the evolution, the optimal parameters may not be the same as before that. It is possible to search for this optimisation manually. However, this is a complex task and may not be practical. The genetic algorithm auto optimisation on https://en.oga.jod.li lets the server take care of this optimisation.
How is this implemented?
Maximise the fitness of the best chromosome
Depending on the use we make of it, the ultimate goal of the genetic algorithm evolution can be to maximise the fitness value for the best chromosome. If we bring this to generations or population batches, this means that batches can be considered having a better performance if their maximum fitness is higher. Thus, the average and minimum fitness are not necessarily relevant to consider the overall performance of the batch. This is especially true if we consider the fact that to avoid local optima, we need to allow lower raw fitness chromosomes to be considered within the population as shown in oga.jod.li niche mechanism through a fitness sharing mechanism.
Defining the batch fitness
The evolution of the parameters of the genetic algorithm is done through another genetic algorithm which fitness function is defined as the chromosome maximum fitness within this batch.
Avoiding old parameters to be used for too long
The parameters must be adapted to the optimum search at the time the evolution is executed. Indeed, parameters that lead to a good performance at the beginning of the evolution may not be appropriate after hundreds of batch iterations. To avoid old parameter sets to remain the best ones for a long time while they may not be relevant anymore, each batch iteration leads to the decrease of the fitness of each parameter batch in a proportion (delta = 300) of the highest fitness. Thus, the oldest ones have a much higher penalty than the most recent ones.
How to control the auto evolution?
Global parameter
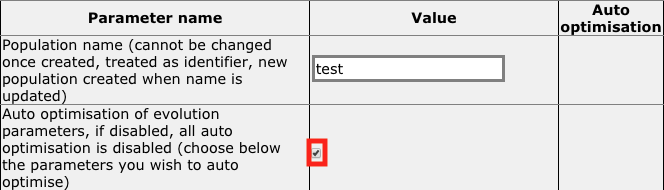
The global parameter for auto optimisation allows the global activation or deactivation of the optimisation of the genetic algorithm parameters. If disabled, all the population parameters will remain as they are set manually. If activated, the population parameters that are set to be auto optimised (see below) will change automatically to improve the performance of the evolution.
Specific parameters
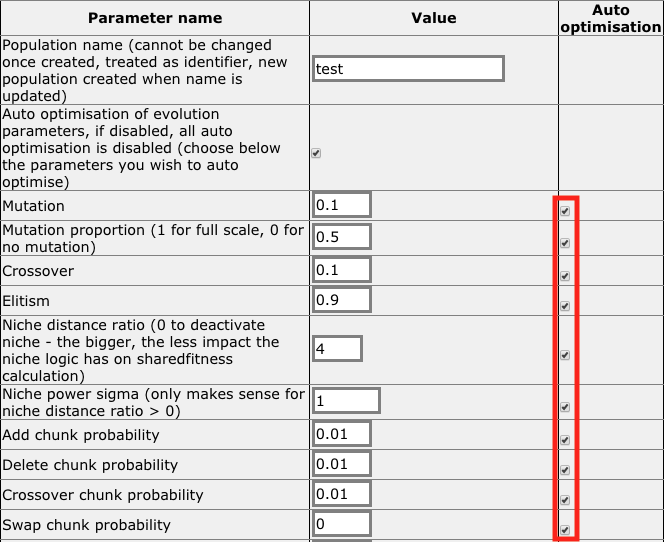
If auto optimisation is globally activated, the following parameters can be set to be auto optimised:
- Mutation
- Mutation proportion
- Crossover
- Elitism
- Niche distance ratio (ndr)
- Niche power sigma (psi)
- Add chunk probability
- Delete chunk probability
- Crossover chunk probability
- Swap chunk probability
How does this impact the evolution?
When the auto optimisation is enabled, the following parameters are evolved within the corresponding boundaries with the corresponding steps:
- mutation: 0.1 -> 0.55, step: 0.05
- mutation proportion: 0.00 -> 1.00, step: 1/9
- crossover: 0.1 -> 0.55, step: 0.05
- elitism: 0.5 -> 0.95, step: 0.05
- niche distance ratio (ndr): 0 -> 100, step: 1 (0 functionally speaking is closer to 100 than 1; thus, the whole scale is shifted down by 1 with the 0 replacing the 100) (on the plots, this value is divided by 100)
- niche power sigma (psi): 1 -> 5.5, step: 0.5 (on the plots, this value is divided by 10)
- Add chunk probability: 0.00 -> 0.30, step: 1/30
- Delete chunk probability: 0.00 -> 0.30, step: 1/30
- Crossover chunk probability: 0.00 -> 0.60, step: 1/15
- Swap chunk probability: 0.00 -> 0.60, step: 1/15
To illustrate the impact of the auto evolution of the genetic algorithm parameters on the genetic algorithm evolution, 2 experiments were done. One with the auto evolution parameter disabled and another one with the auto evolution parameter enabled. Here are below the parameters common to the 2 populations:
- The mutation rate: 0.3 (initial value only for the auto evolve case)
- The crossover rate: 0.2 (initial value only for the auto evolve case)
- The elitism rate: 0.5 (initial value only for the auto evolve case)
- The niche distance ratio (ndr): 10 (initial value only for the auto evolve case)
- The niche power sigma (psi): 1 (initial value only for the auto evolve case)
- The minimum length: 2
- The maximum length: 3000
- The encoding: xdigit (hexadecimal)
- The envelope: CSV
- The number of chromosomes per batch: 40
The parameters which were different are the following ones.
First evolution with auto optimisation disabled:
- The population name: nonautotest49
- The auto optimisation: false
First evolution with auto optimisation enabled:
- The population name: autotest50
- The auto optimisation: true
The objective of the evolution consisted in finding the shape and pixels of a PNG image that would have a smaller size interlaced than non interlaced (while usually, interlaced PNG images have a larger size than the equivalent non-interlaced). The fitness equals the size difference between the same image interlaced and non-interlaced offset by 200 to avoid being lower than 0. More explanation on the PNG interlaced size optimisation experiment can be found here.
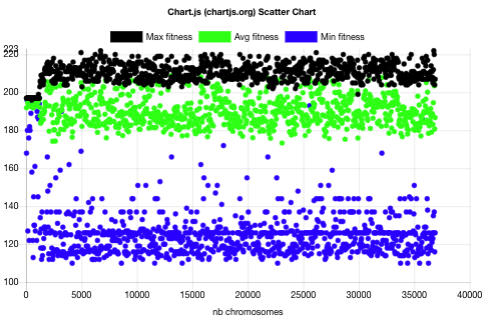
Results for the first evolution with auto optimisation disabled:
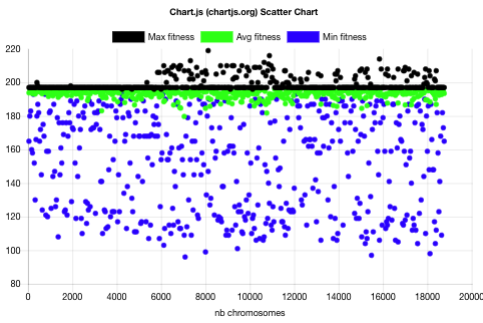
The above batch fitness plot shows that:
- The maximum fitness is reached at 219 after 203 batches (8120 chromosomes).
- This maximum fitness is not overcome for the next 266 batches (10640 chromosomes).
- The population batches have a rather stable and narrow maximum and average fitness around the 197 line (the one usually for PNG images with a 1 pixel height).
- Many of the 485 have a minimum fitness below 160 showing that the genetic algorithm is trying to overcome the local optima by exploring chromosomes that differ from the best fit potential parents.
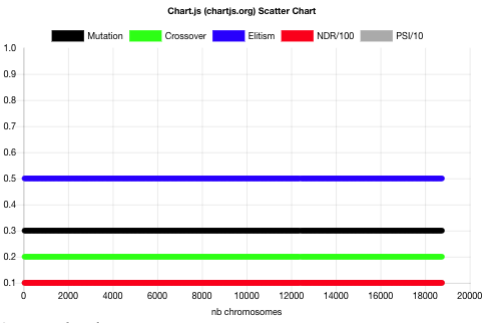
As expected and shown below, the evolvable parameters didn’t change over time with this experiment:
The PNG image corresponding to the best chromosome is the following one (width 1 x height 731, 2824 bytes interlaced, 2843 bytes non-interlaced):
![]()
Results for the second evolution with auto optimisation enabled:
The above batch fitness plot shows that:
- The maximum fitness reached with the first experiment is overcome with 221 after the batch 124 (4960 chromosomes) while it took 203 batches to reach 119 in the first experiment. In this particular case, the auto evolution is 39% faster than the population with auto evolution disabled.
- The maximum fitness reached with auto evolution enabled is 222 after 168 batches (6720 chromosomes).
- The maximum fitness did not improve for the next 754 batches (30160 chromosomes). Though, under the right circumstances, it is possible to reach a fitness of 230.
Shown below, the genetic algorithm parameters evolved over time:
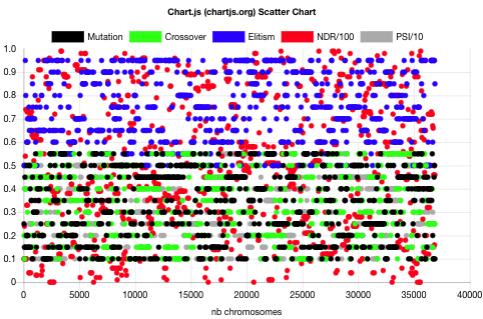
Not pattern or trend seems to be readable from the above plot. To the human eye, the parameter choices seem random.
The PNG image corresponding to the best chromosome is the following one (width 1 x height 505, 2036 bytes interlaced, 2058 bytes non-interlaced):
![]()
The height of the best chromosome fitness PNG in the auto enabled case is 31% smaller than the one for the auto disabled case. This is surprising since having a taller image gives more chances for the interlace image to be smaller than the non-interlaced one. It may be more difficult for the evolution to increase the height of the PNG than to find pixels leading to a smaller interlaced PNG.
Applying the best auto optimised parameters to manual experiments
The PNG interlace size experiment has been used for 10 runs of 2000 chromosomes auto optimised. The best genetic algorithm parameters resulting from those experiments have been used for 10 runs of 2000 chromosomes with manual parameters. Both cases have been run with and without niche. Experimentation files can be found here. Here are the results below:
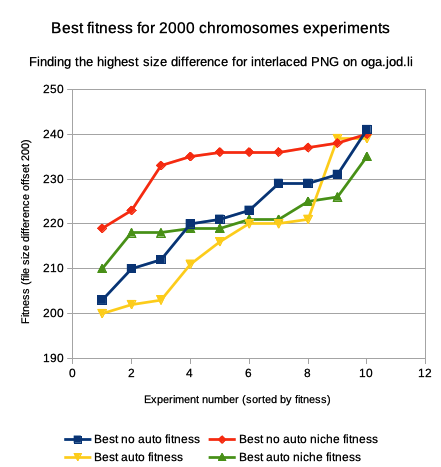
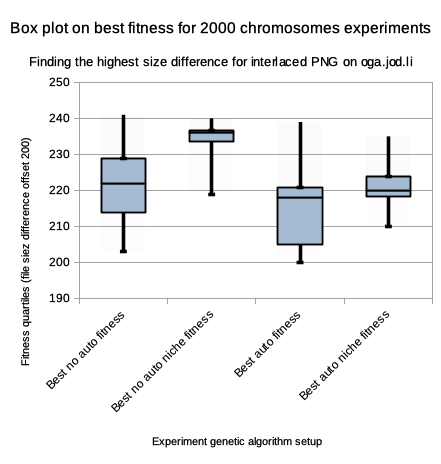
The main outcomes of those graphs are:
- Activating the niche mechanism generally improves the experiment results.
- The overall performance of the manual experiments with the best parameters of the auto evolved experiments is generally better than the auto evolved experiments. This can be explained by the fact that the auto evolution requires batches for self tuning the parameters.
Conclusion
The evolution of genetic algorithm parameters through a genetic algorithm can improve the performance of the evolution. Though, this is not necessarily enough to find the globally best fitness. Analysis is necessary in the case presented to find a more global optima. The auto optimisation can be used in many cases to find the best genetic algorithm parameters for a given problem and apply them in a manual way for better results.
Future work
Other mechanisms should be investigated. In particular, some that would be less dependent on the fitness scale and require less attempts. For example, a neural network could learn the best strategies from the genetic algorithm evolving the parameter and apply them for upcoming evolutions.
It would be interesting to fine-tune the boundaries and probabilities within which the parameters can be optimised. Pruning of the potentially irrelevant parameters would also help.
Verify whether the auto optimisation is better performing than random choices of the parameters.
Although it has been repeatedly noticed that the oga.jod.li auto optimisation mechanism presented is relevant for the interlaced PNG problem, it would be necessary to demonstrate the relevance or not for other problems. Feel free to send your findings.